Build a multi-scene data story
About 10 minutes
One chart is a fact; a sequence is a story. Chartimator videos are chains of scenes, and the strongest ones follow a simple arc: hook, evidence, payoff.
- 1
Start from a story template
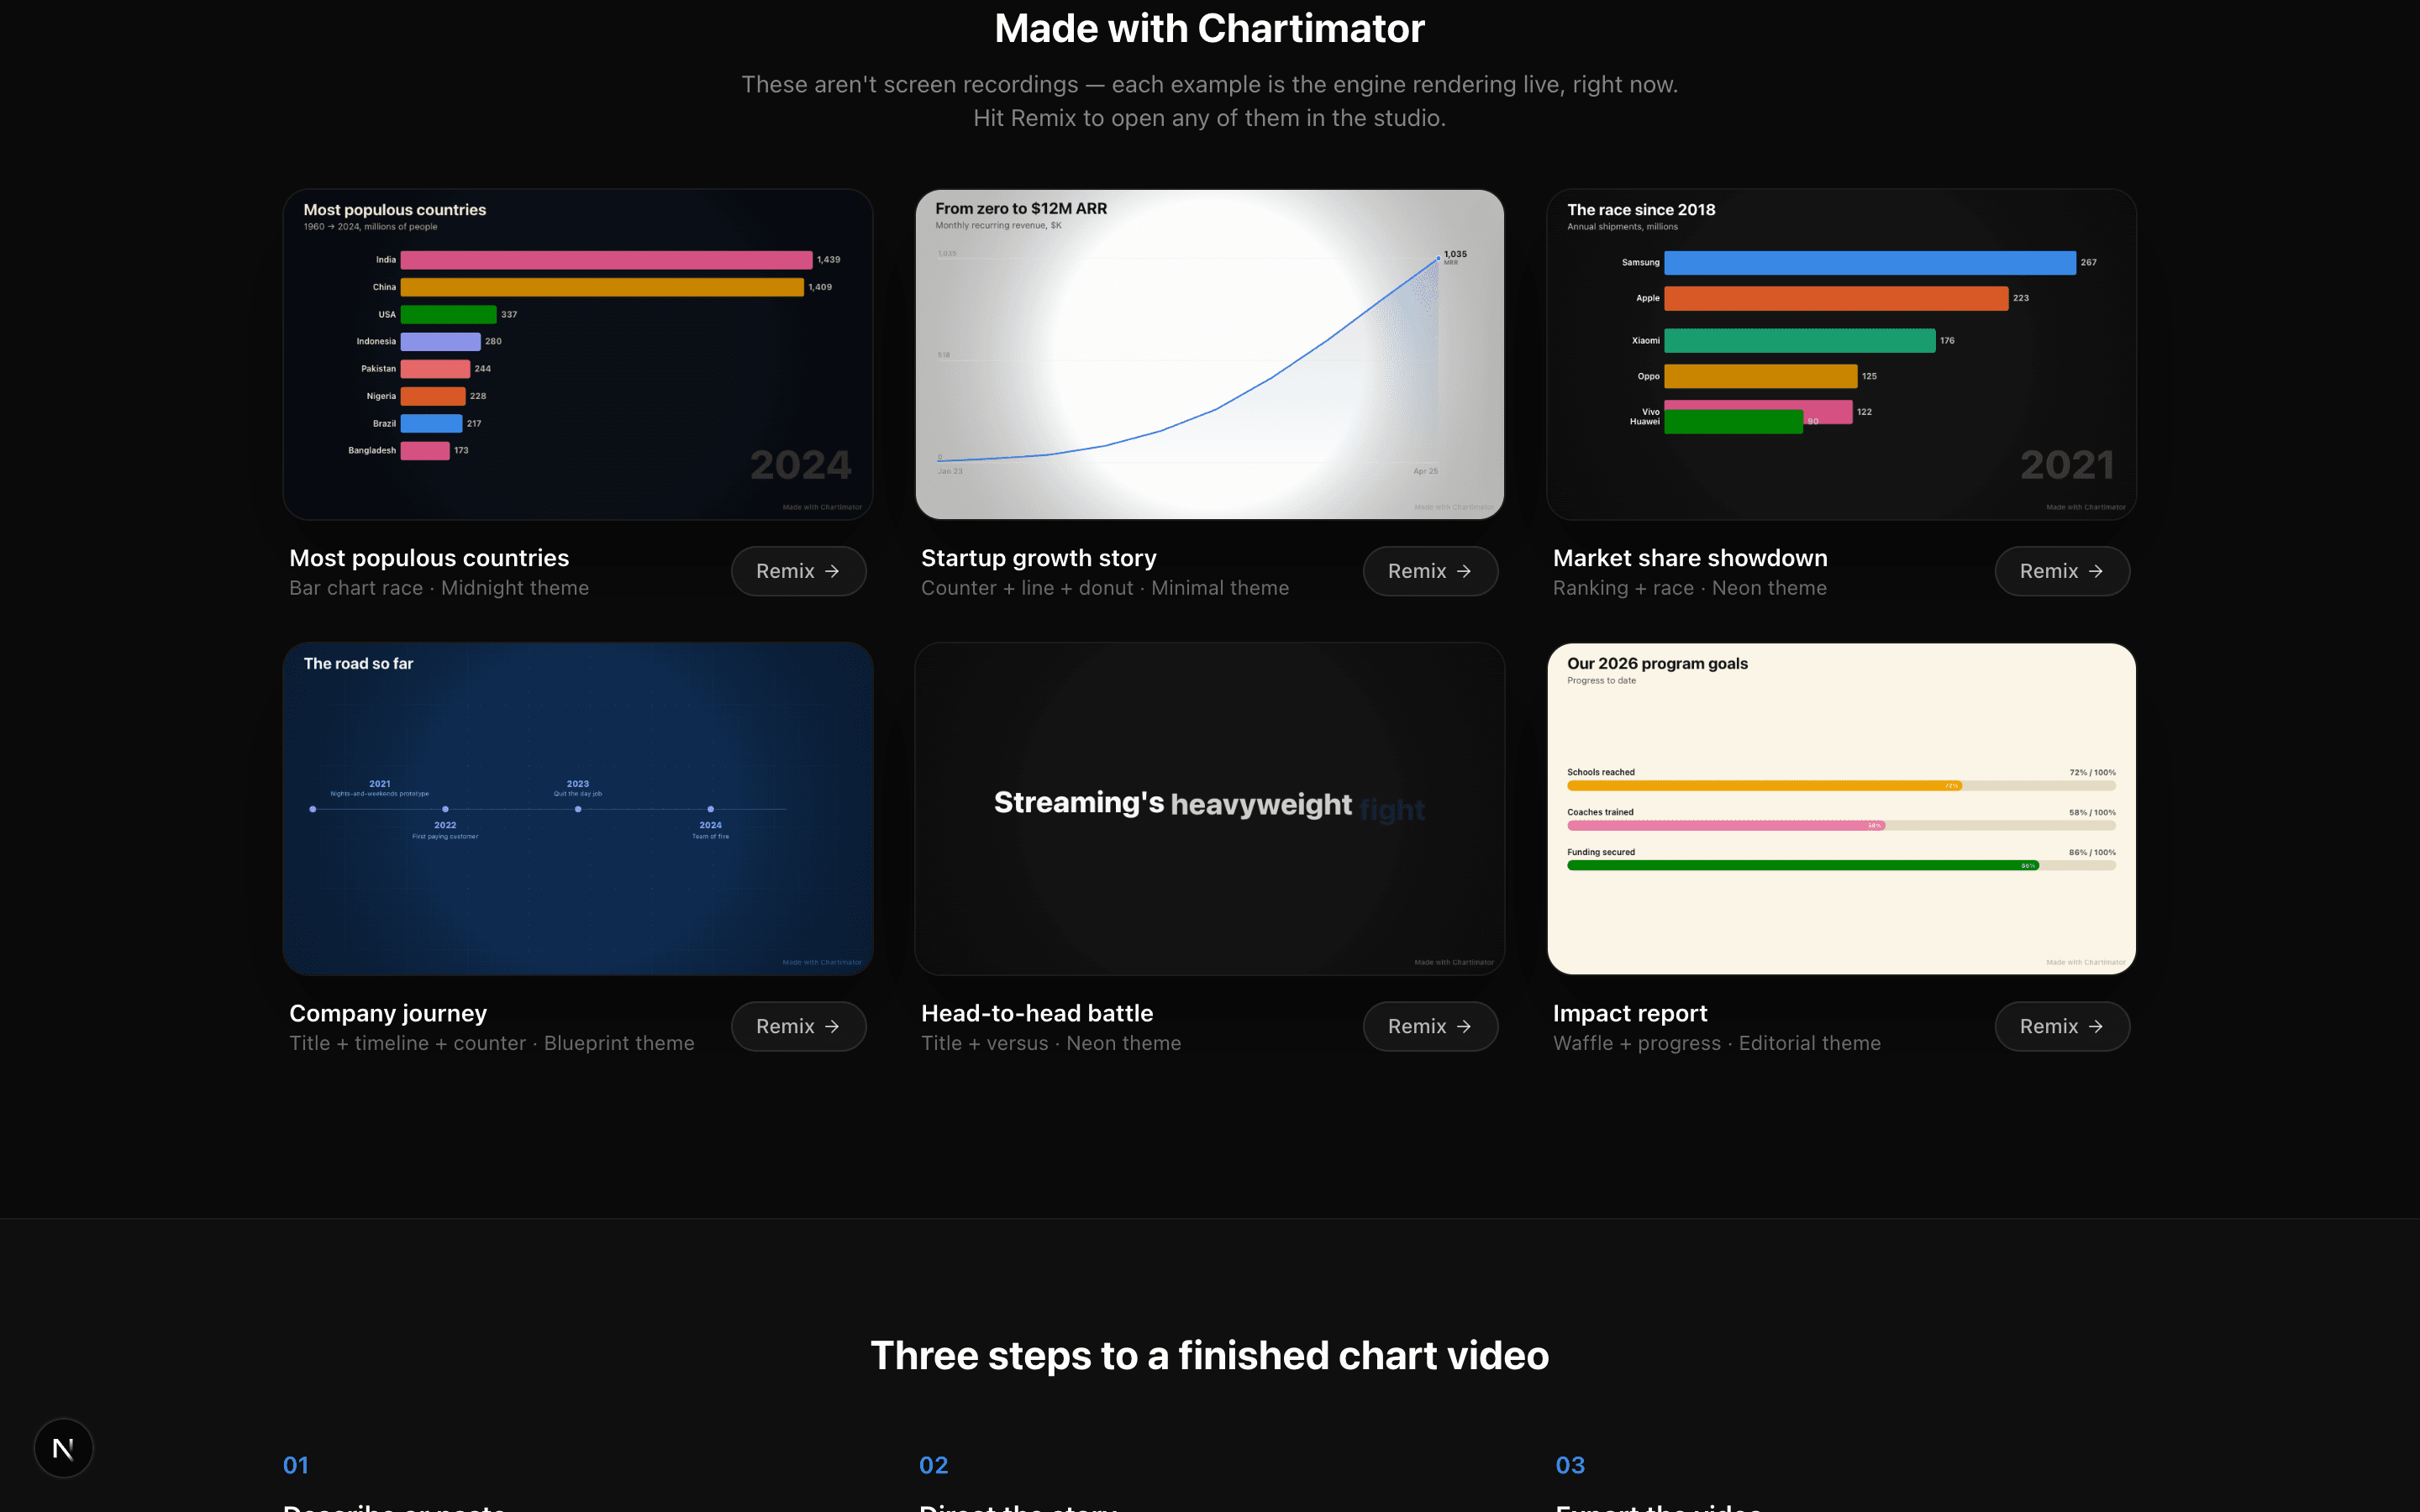
The homepage gallery shows live multi-scene examples — "Company journey" opens with a title card, walks a timeline, and lands on a counter. Hit Remix on any of them to open the full scene chain in the Studio and see how it's put together.
- 2
Understand the scene list
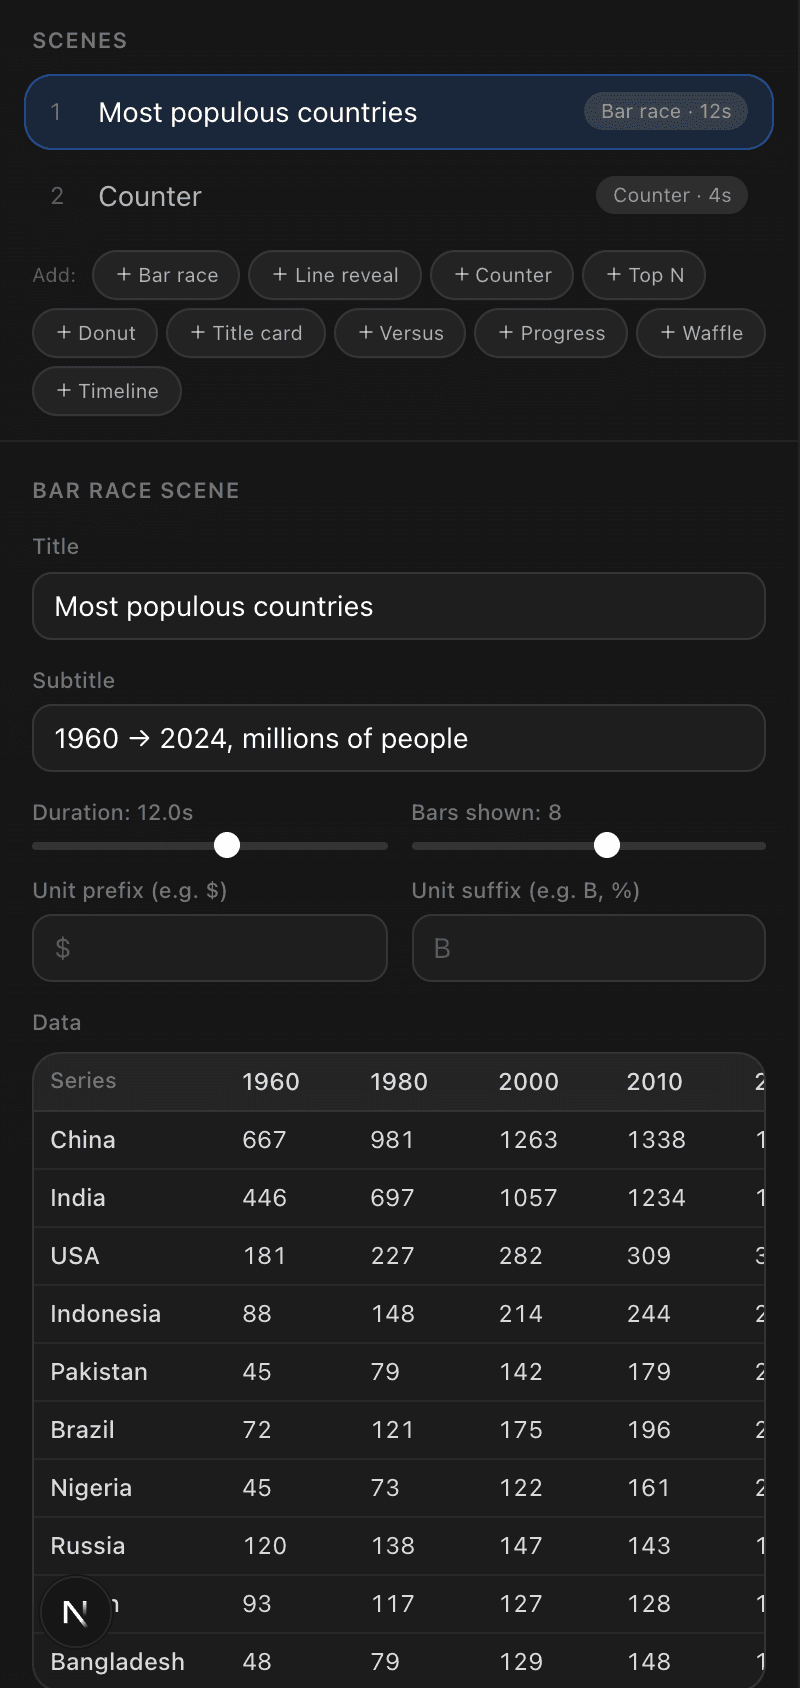
Each row in the Scenes panel is one segment of your video, played in order with an automatic crossfade. Click a scene to edit it; hover for reorder arrows and delete. The preview scrubber runs across the whole chain, so you can watch transitions in context.

- 3
Open with a hook
Add a Title card scene and drag it to position 1 (or lead with your most surprising number as a Counter). Keep it under ten words — the last word automatically lands in your theme's accent color. This is the 2 seconds that decides whether anyone keeps watching.
- 4
Stack the evidence
Follow with 1–2 data scenes that carry the argument: a bar race for rankings over time, a versus for head-to-heads, a waffle for "1 in N people", a timeline for milestones, progress meters for goals. Keep each scene to one idea — two short scenes beat one crowded one.
- 5
Land the payoff and export
Close with a Counter holding the single number you want remembered. Watch the full run once from the start, check the total duration (under 30 seconds for social), then Export. The MP4 renders in your browser and downloads when done.