Create your first chart video in 5 minutes
About 5 minutes
This walkthrough takes you from a one-sentence idea to a downloaded MP4. No account, no installs — everything happens in the browser.
- 1
Describe your data story
On the Chartimator homepage, type what you want in the prompt box — a topic, a time range, a comparison. Be as specific as you like: "Top 10 most subscribed YouTube channels, 2015 to today" gives the AI Director everything it needs. If you have your own numbers, drop a CSV on the box instead (or as well). Then hit Generate video.

- 2
Review the AI's draft in the Studio
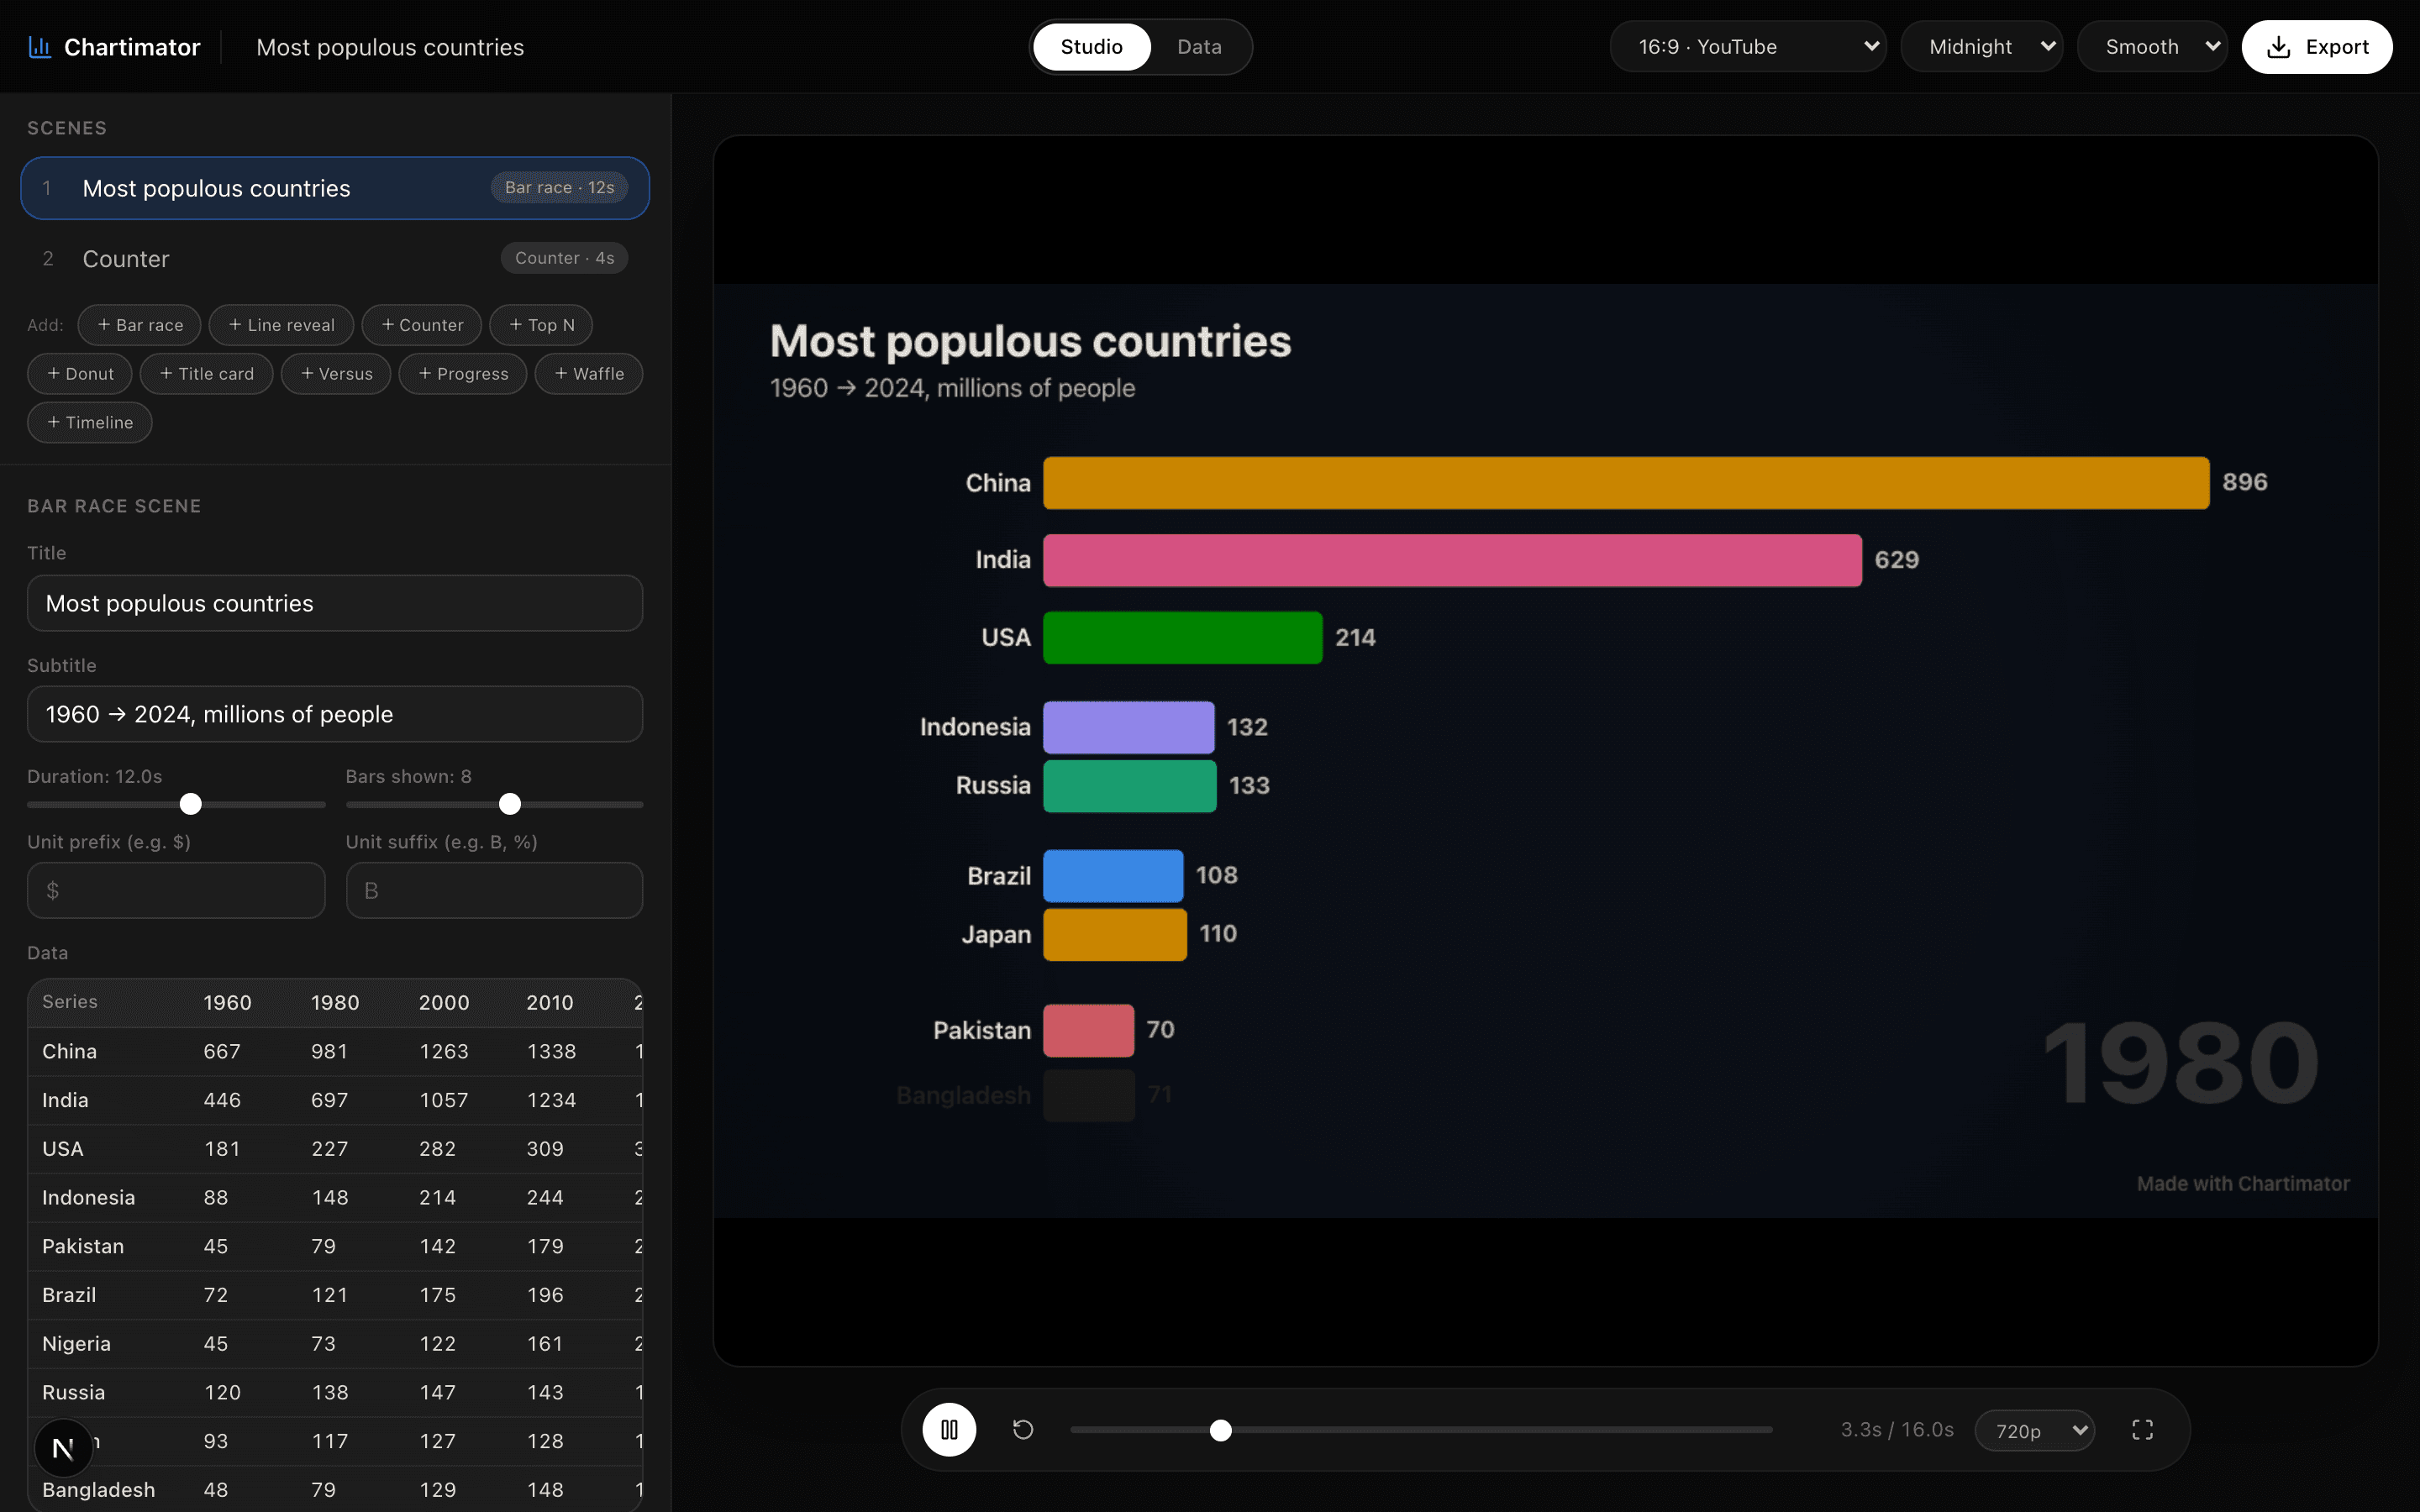
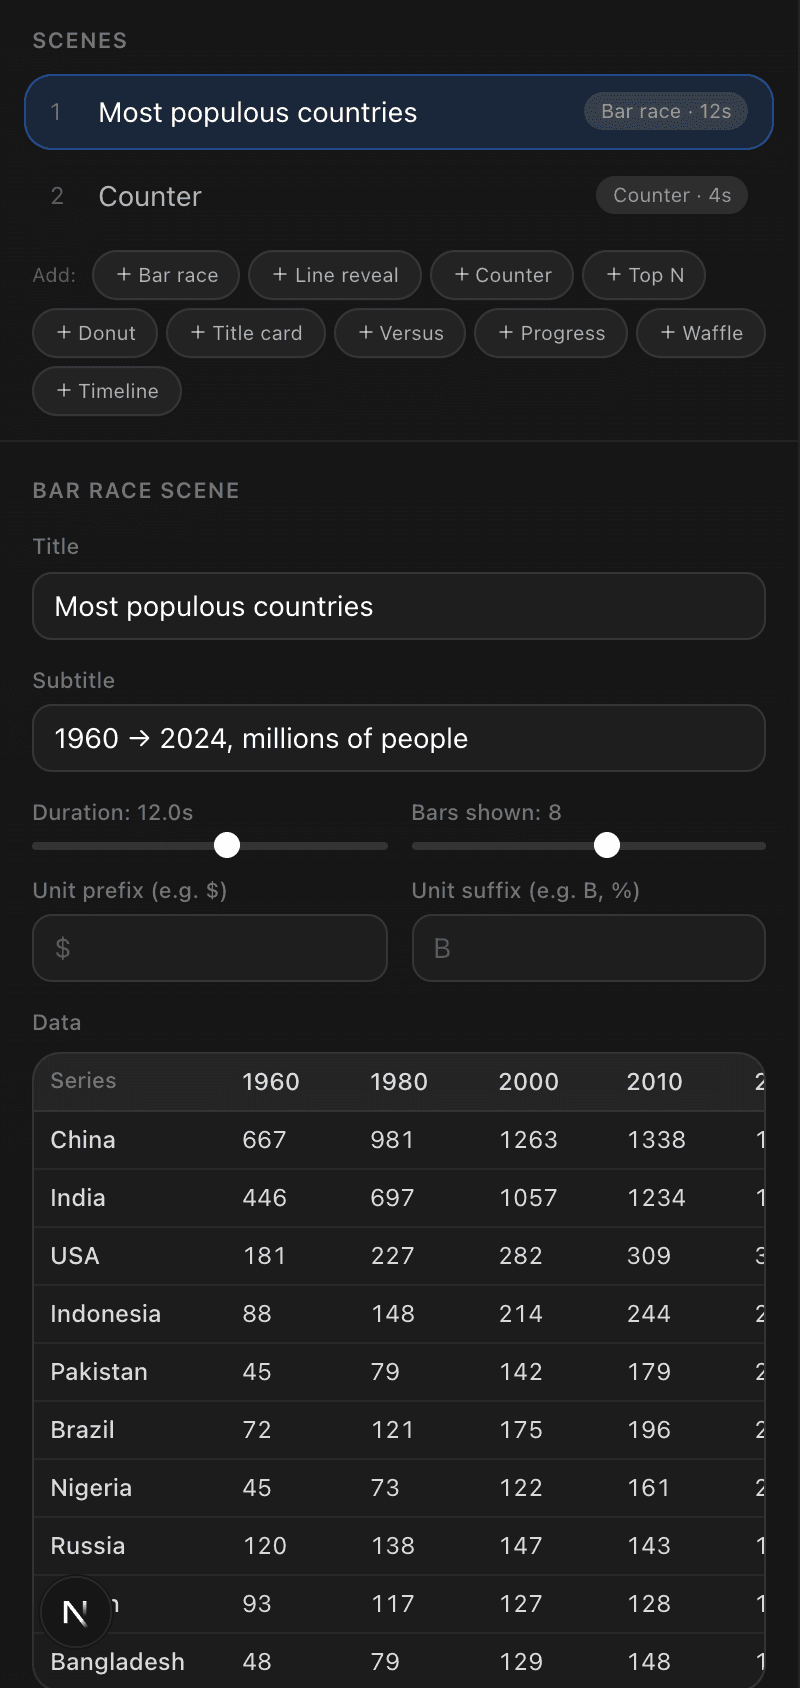
A few seconds later you land in the Studio with a playing preview. The left sidebar lists the scenes the Director planned; the inspector below it holds the active scene's title, subtitle, duration, and data. Nothing here is final — every choice the AI made is just a starting value you can change.
- 3
Check the numbers
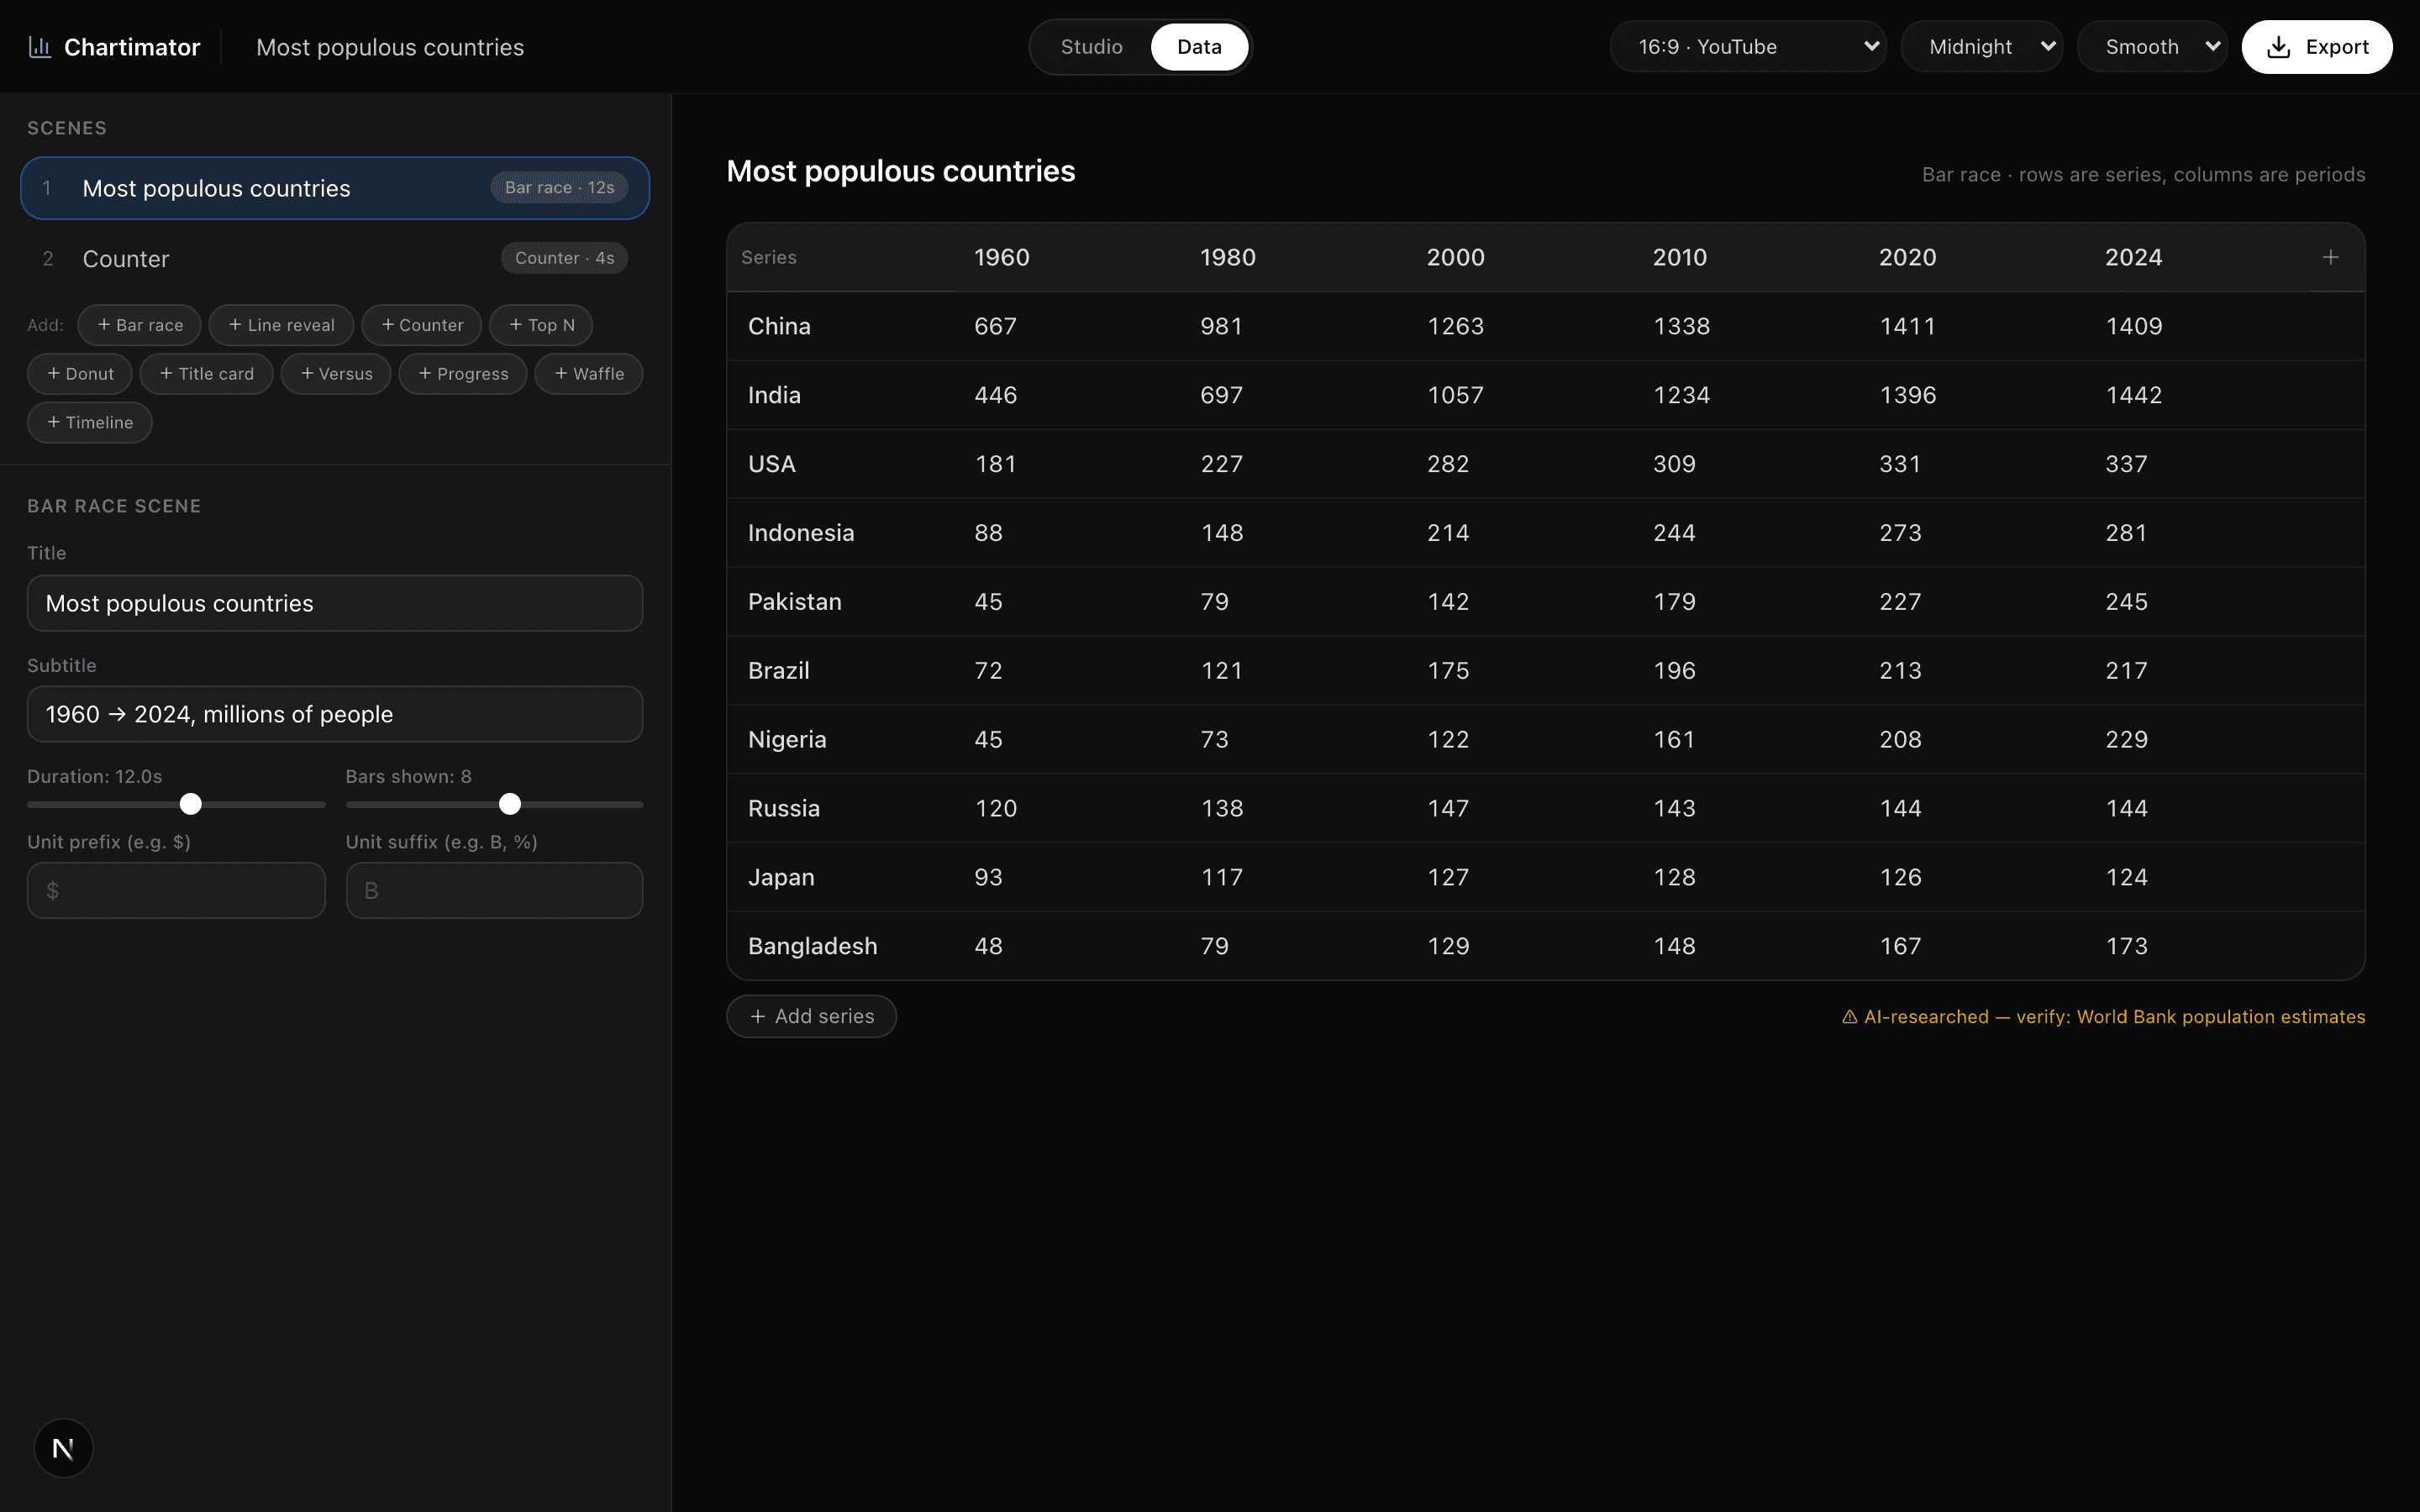
If the AI researched the data for you, an amber "AI-researched — verify" badge shows its sources under the data grid. Click any cell to correct a value, add or remove rows and columns, and watch the preview update instantly. For bigger edits, flip the header switch from Studio to Data for a full-width comfortable grid.
- 4
Style it
In the header, pick your format (16:9 for YouTube, 9:16 for TikTok and Shorts, 1:1 for feeds), a theme (Minimal, Midnight, Neon, Editorial, or Blueprint — all colorblind-safe), and a motion pace (Hype, Smooth, or Gentle). Per scene, set units with the prefix/suffix fields — a bare "130" reads as nothing; "$130B" tells the story.
- 5
Export your MP4
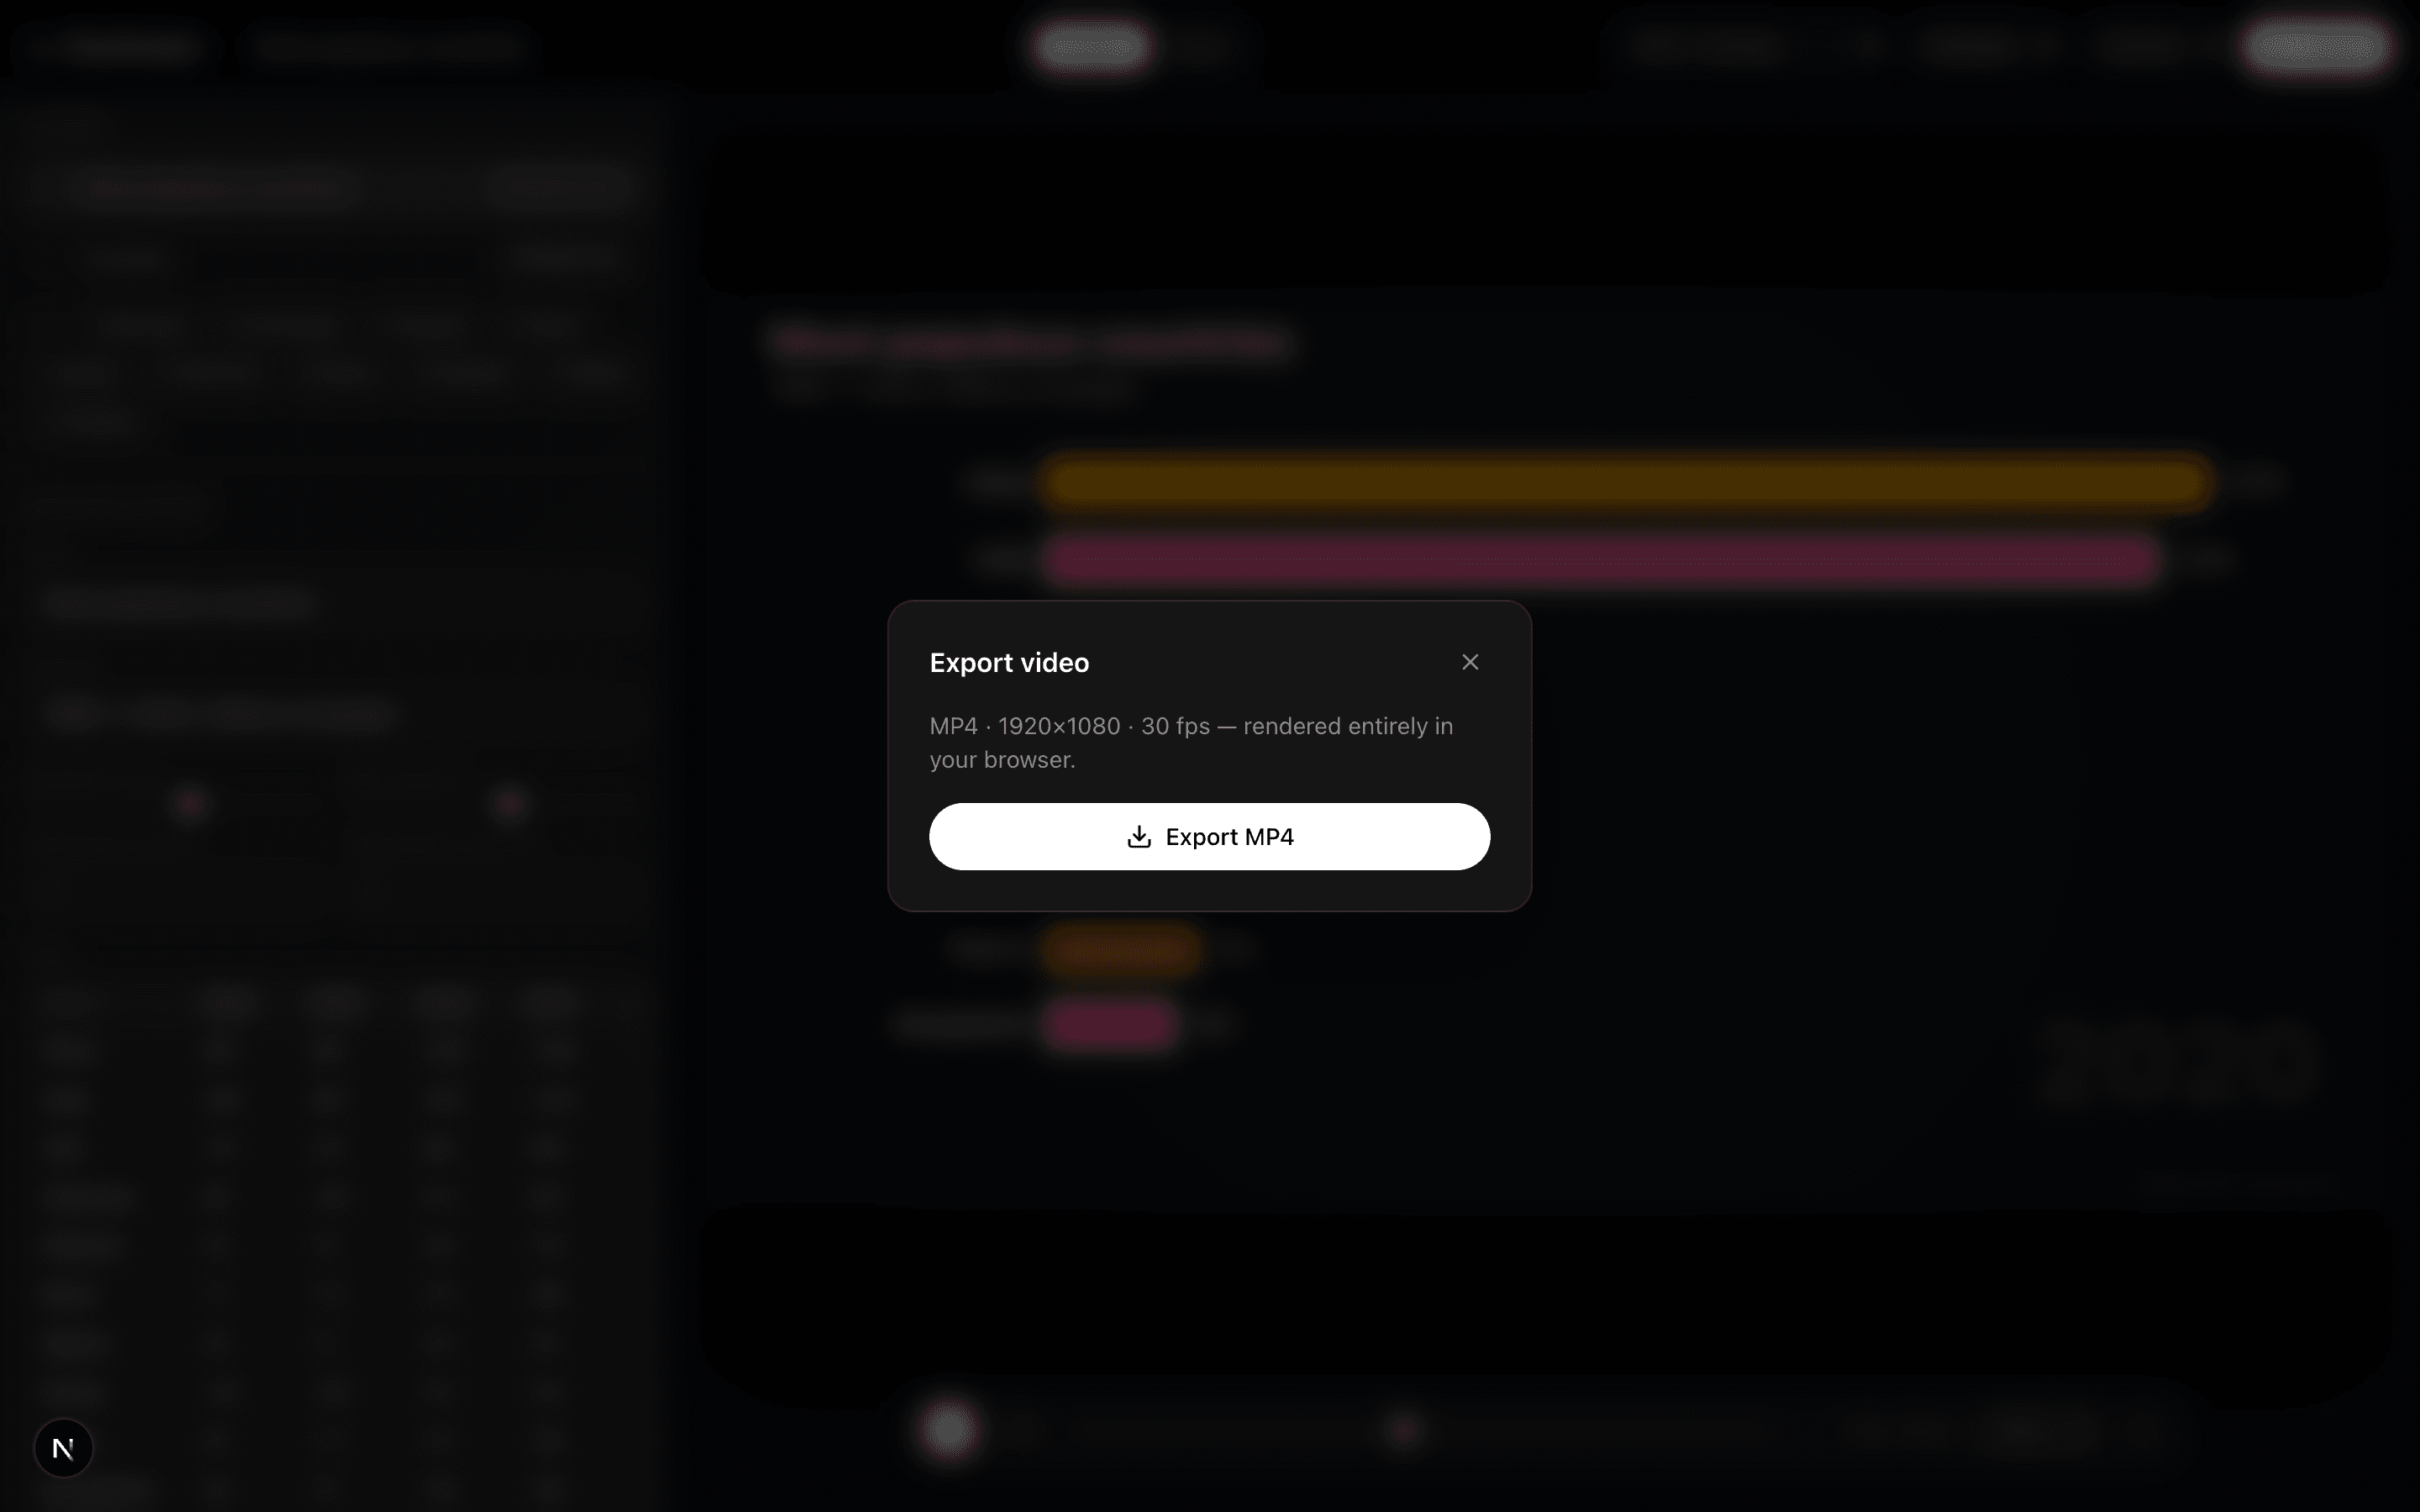
Hit Export. Frames render and encode entirely in your browser — no upload, no queue — and the MP4 downloads when it finishes. Preview quality (480p/720p/1080p) only affects the editor; exports always render at full resolution for the chosen format.